DATA VISUALIZATION OF 1ST FRENCH ELECTION ROUND FROM 2021
Hello to you, dear reader. On this website you will find different informations about the first french election round from 2021.
This is a project made by the IUT of the Puy-en-Velay in FRANCE, its purpose is to show a data visualization for an english newspaper.
First of all, here's a map of the France with all it's regions (island included, it's yours to find them on it).
It will give you a lot of informations concerning the ballots of all the candidates, in each region.
As you can see, Marine LE PEN and Emanuel MACRON were the two main candidates of this election. But here's a question about a specific region: Corsica.
Did the abstention of the Corsia can be linked to the ballots of Eric ZEMOUR ?
I ask this because it was in Corsica where Eric ZEMOUR made the best percentage.
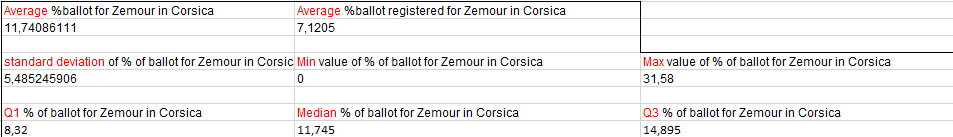
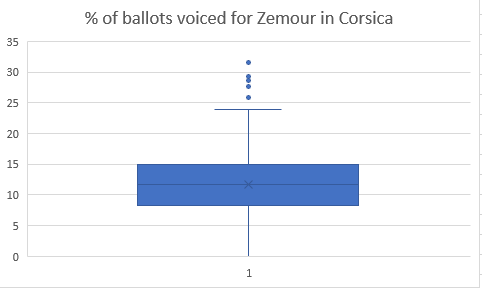
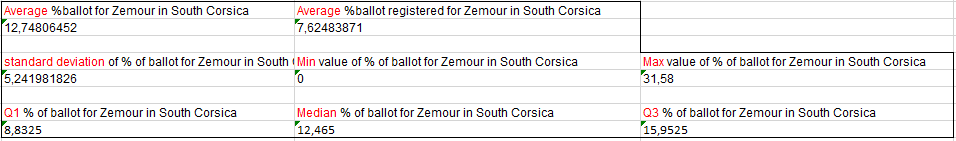
So I did some statistics with the whole region and its two departments.
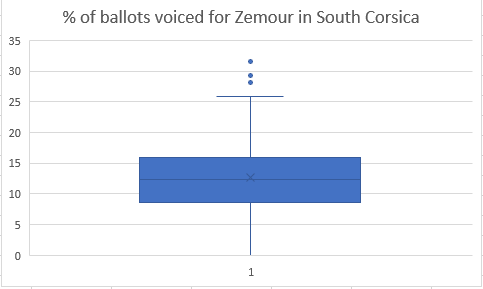
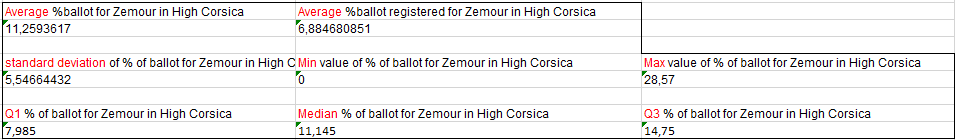
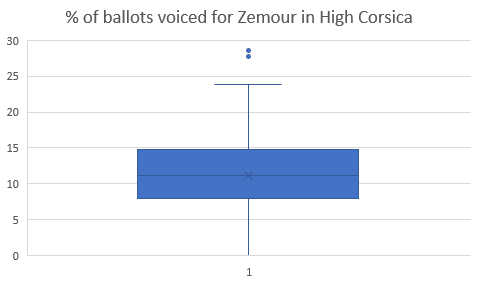
With these stats, we can see that the values are dispatched from 0 to 31 but with a standard dispersion of approximatively 5%, which is pretty good.
It means that the majority of the ballots were beetween 8 and 14/15.
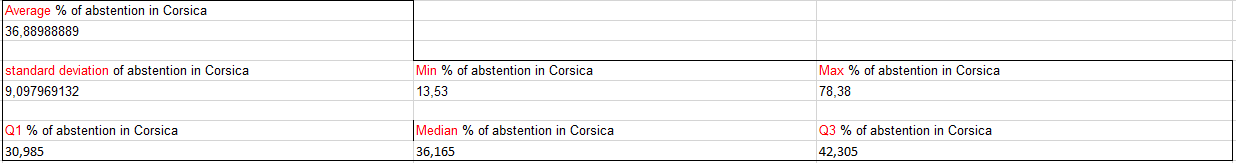
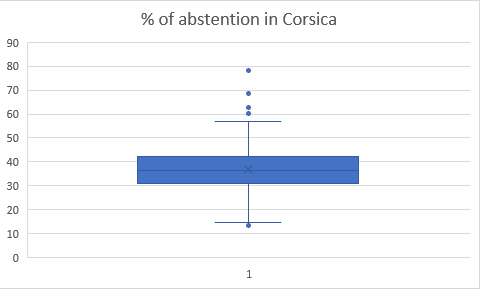
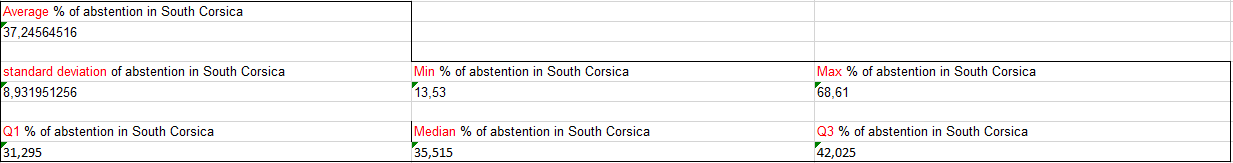
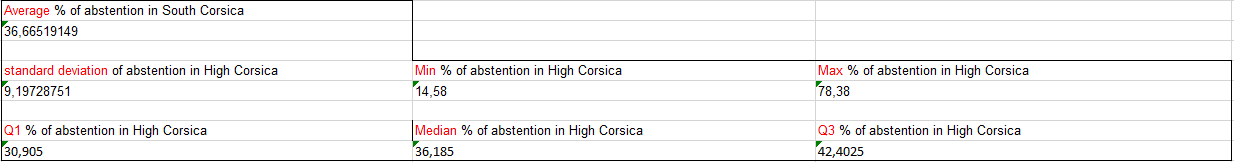
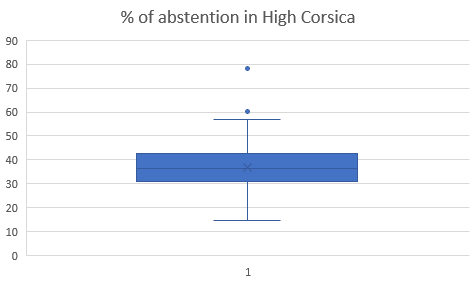
Here, we understand that the abstention is high but is going from 9 to 79% which is huge. The average abstention is one of the higher bellow french islands.
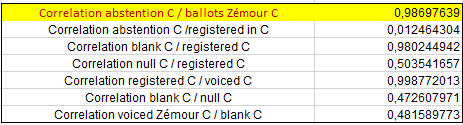
So? Does the abstention in Corsica really has an impact with the ballots for Eric ZEMOUR ?
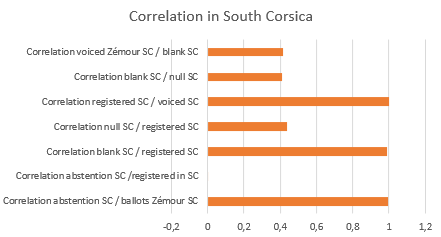
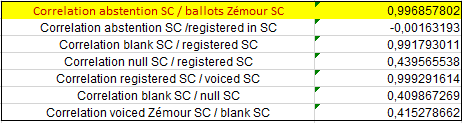
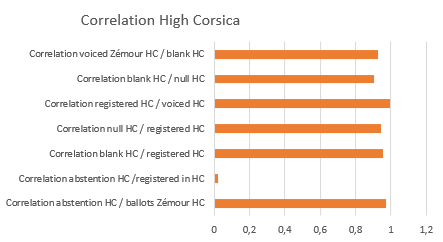
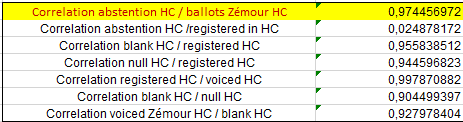
Well actually, YES, and a lot! The correlation coefficient is almost at 0.98 which means that the two factors are tightly connected.
If the abstention rise, the ballots for Eric ZEMOUR will rise too and this also works in the other way: if the ballots fall down, the abstention will too.
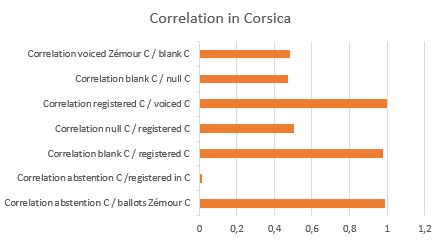
I did some research for other factors like the registered, voiced, blanks or null ballots.
The notable informations are theses:
- the number of registered ballots and the number of voiced ballots for Eric Zemour in Corsica are highly linked
- the number of registered ballots and the number of blank ballots in Corsica are highly linked
- the number of registered ballots and the abstention in Corsica are almost not linked at all
Here, we can see that the South Corsica is practically identical to the global Corsical. Except that it's average ballots for Eric ZEMOUR, median and 3rd quartile are a bit higher.
Some stats are a little bigger than the whole Corsica (average of ballots for ZEMOUR, first quartile). But there is a bit less dispersal, so the median is lower.
Once again, we have the same correlations that we saw with the whole Corsica.
The High-Corsica has really similar data with the whole Corsica concerning the ballots for Eric ZEMOUR.
There too, the stats are almost identical to the whole Corsica. The minimal percentage of abstention is the only value higher.
This time, we got a different evolution of the correlation. The High-Corsica have a higher correlation for these three relations:
- The correlation between the number of blank and null ballots
- The correlation between the number of null and the registered ballots
- The correlation between the number of blanks and registered ballots